
The Dashboard Doppelgänger: When GenAI Meets the Human Gaze
Dashboard Experiments in phases with Traditional ChatGPT, Data Analyst Agent, and Data Visualization Expert Agent. Diving into why AI needs more than context.


This piece is a community contribution from Antonio Neto, Senior Business Intelligence Engineer at Fullstack Labs, and Livia Fazolato, Data Analyst & AI Advocate at iFood. Antonio specialises in visual storytelling, information management, strategy and consulting and is a strong advocate for data literacy, combining analytics and SQL genius to turn data into actionable insight. Livia’s expertise spans advanced analytics, data governance, KPI design, and dashboard optimisation (among others), driving impactful, data-driven solutions across global and national companies. We’re thrilled to feature their unique insights on Modern Data 101!
We actively collaborate with data experts to bring the best resources to a 10,000+ strong community of data leaders and practitioners. If you have something to share, reach out!
🫴🏻 Share your ideas and work: community@moderndata101.com
*Note: Opinions expressed in contributions are not our own and are only curated by us for broader access and discussion. All submissions are vetted for quality & relevance. We keep it information-first and do not support any promotions, paid or otherwise!
Since the explosive launch of ChatGPT and other generative AI tools, fears about machines replacing professionals have become increasingly common. In some industries, like Hollywood, this concern has already led to action, including strikes by screenwriters and actors demanding safeguards against automation.
But is this fear valid? Could it happen in the near future?
You may not like the answer, but here it is: yes.
According to recent research from the World Economic Forum:
Almost half of all employers expect to reduce their workforce over the next five years... citing AI as a key factor in making many roles and skillsets obsolete.
This concern isn’t just theoretical. It’s already unfolding.
In 2023, IBM made a bold move: it laid off around 8,000 employees, primarily from the HR department. The goal? To automate repetitive, well-defined tasks, cut costs, and boost efficiency. According to the company itself, productivity increased by more than 90%.
But is it really that simple? Are we replacing people, even specialists, with AI?
Let’s put it in more practical terms: Can generative AI create dashboard mockups? Can it replace information designers?
Invited by 101 Modern Data, we, Antonio Neto and Lívia Fazolato, decided to find out. We simulated a real-life scenario: we gave ChatGPT the same kind of information a data visualization designer typically receives and asked it to generate a dashboard prototype.
Did it work?
You might be surprised.
One note: many of the mockups you’ll see are labeled in Portuguese, especially in the initial phases. That was intentional. As Brazilian researchers, we ran the experiment in our native language to reduce noise and help the AI better grasp contextual nuances.
The Context
To make the experiment as realistic as possible, we built it around a common data visualization use case: a sales performance analysis using the public dataset "Sample - Superstore.xls," widely used in BI tools like Tableau and Power BI.
👤 The Persona: Sales Channel Manager, Gabriel Mendes
Gabriel is a newly promoted Sales Channel Manager at a global company with a decentralized data infrastructure. He was the requester for the dashboards in this experiment. With 20+ years of experience in digital marketing, he knows his way around online tools. But he’s still getting familiar with the complexities of sales operations and needs data visualizations to support quick, strategic decision-making.
🧩 What Gabriel Needs
Gabriel requested two complementary dashboards:
An executive dashboard with a high-level view, designed for leadership use;
An analytical dashboard for daily use by the Sales Channel team.
The dashboards will be accessed on demand or in meetings, with data refreshed daily (D-1). They're meant to be used independently by stakeholders with different levels of expertise, from executives to analysts, but each audience will focus on different insights.
Although Gabriel is new to the sales world, he doesn’t see the need to involve an information designer. He believes generative AI can handle the mockup process on its own, without requiring deep technical expertise.
🎨 Visual and Functional Requirements
The dashboards should be designed primarily for desktop, with mobile optimization for the executive version;
The visual style should be clean and aligned with the company's brand identity;
Preferred typography: Inter or Montserrat, with clear visual hierarchy;
Functional highlight colors: dark blue (#005F99), light blue (#CCE6F6), orange (#F17C28), soft red (#E04B4A);
The layout must support screen-sharing, quick scanning, and easy export.
Working with ChatGPT
Throughout the experiment, we tested multiple ways of interacting with ChatGPT (GPT-4o, via a Plus subscription), exploring its capabilities as a dashboard co-pilot, specifically in the role of an information designer.
We split the experiment into two complementary phases:
A zero-shot approach with minimal briefing, testing each agent individually.
A structured approach with full context, defined roles, and agent collaboration.
🧪 Phase 1: Three Agents, Minimal Briefing
We tested three different ChatGPT configurations, each acting as a solo information designer:
Traditional ChatGPT (the default version most users interact with;
All agents received short, objective prompts, reflecting real-world scenarios where people ask for quick help without proper briefing.
Prompt 1
A clear instruction to only consider the input within that session, ignoring memory or past interactions.
Each agent followed up with questions:
The Traditional ChatGPT asked about preferred BI tools, key objectives, and relevant dimensions;
The Data Analyst Agent asked which metrics were most important, who the audience was, and whether there were specific visual requirements;
The Data Viz Expert Agent asked whether the dashboard would be used for internal analysis, external reports, or training, as well as questions around design preferences and reference models.
Prompt 2
We shared the dataset and wrote:
Here is the dataset. I want a mockup of an executive dashboard that gives a high-level view of results. You choose which metrics to show and define any visual or functional elements. The mockup will be the basis for building the final dashboard in a tool like Tableau or Power BI. Audience: Sales Channel Manager.
Each agent responded differently:
Traditional ChatGPT
Traditional ChatGPT was the only one to draft a mini-briefing based on its earlier questions and ask for validation before generating the mockup. This user-centric behavior led to a more coherent visual layout, despite flaws like imbalanced proportions and missing visual identity. Still, it came closest to a usable dashboard and was chosen to move forward in Phase 2.

Data Analyst Agent
Data Analyst Agent skipped the briefing and went straight into suggesting individual charts based on the dataset. It didn’t deliver a full dashboard but demonstrated good analytical insight and metric prioritization. We later assigned it the role of team analyst in Phase 2, focusing on exploratory analysis and data interpretation.
Data Visualization Expert Agent
Data Visualization Expert Agent initially delivered only one chart. After we clarified the goal, it responded with a textual layout description, including KPIs, filters, and a suggested structure, followed by an image. It showed theoretical knowledge but lacked cohesion. We redirected this agent to a support role in the design requirements phase.
📌 Conclusion of Phase 1
Even with specialized agents, we saw that low contextualization and isolated use of chats significantly compromise the quality of the output. Basic elements of dashboard design,like visual analysis flow, metric prioritization, cross-page consistency, and real-world usage adaptation,were left out. At this point, AI’s potential seemed promising but poorly leveraged.
What We Learned
To unlock more value from GPT, we structured a collaborative project between agents,with defined roles, clear instructions, and a complete briefing. This became the foundation of Phase 2, where we tested how AI behaves in a more integrated setup, simulating a multidisciplinary data and design team.
🧭 Phase 2: One Project, Multiple Agents, Full Briefing
In the second phase, we created a Project within ChatGPT that brought all agents together into a shared collaborative space. This feature, available only to Plus, Pro, and Teams users, allowed us to centralize chats, files, and tailored instructions in a single environment with persistent memory and continuous context. It was the ideal setup for a complex, iterative task like dashboard development.
🎯 Main Project Instruction
“This project aims to develop two dashboard mockups (one executive and one analytical) in image format based on a dataset called Super Store. Three distinct agents will be used in the process:
Data Analyst: perform exploratory analysis, suggest metrics and visual/functional requirements.
Data Visualization Expert: raise strategic questions to support design decisions.
Traditional ChatGPT: transform the guidelines into visual mockups.
Finally, act as an information designer and feel free to ask any questions or make suggestions to improve the mockups.”
🧠 Structuring the Team
This time, the key difference was the level of context provided. We defined:
The persona: Gabriel, a newly promoted Sales Manager;
The real-life usage scenario for the dashboards;
The main design goals and constraints;
And the expected visual identity for the layouts.
With this foundation, each agent stepped into its role:
The Data Analyst acted as the “analytical brain” of the team, diving into the dataset and suggesting the most relevant metrics for decision-making. Human curation helped guide the process, steering clear of unnecessary granularity (such as Customer ID, Product Name, or overly tactical measures).
The Data Visualization Expert challenged the project with a structured set of questions split into two blocks: "general understanding and vision alignment" and "creative process details." These prompts covered visual pitfalls, user expectations, filter modeling, analytical components, comparative metrics, and insight prioritization.
Based on the answers provided by the duo Lívia and Antonio (acting as stakeholders), the Data Analyst then developed two key deliverables:
A technical briefing consolidating design decisions, functionalities, and objectives;
And two textual wireframes (executive and analytical), outlining the structure in natural language.
🧪 New Experiment: The Impact of Context
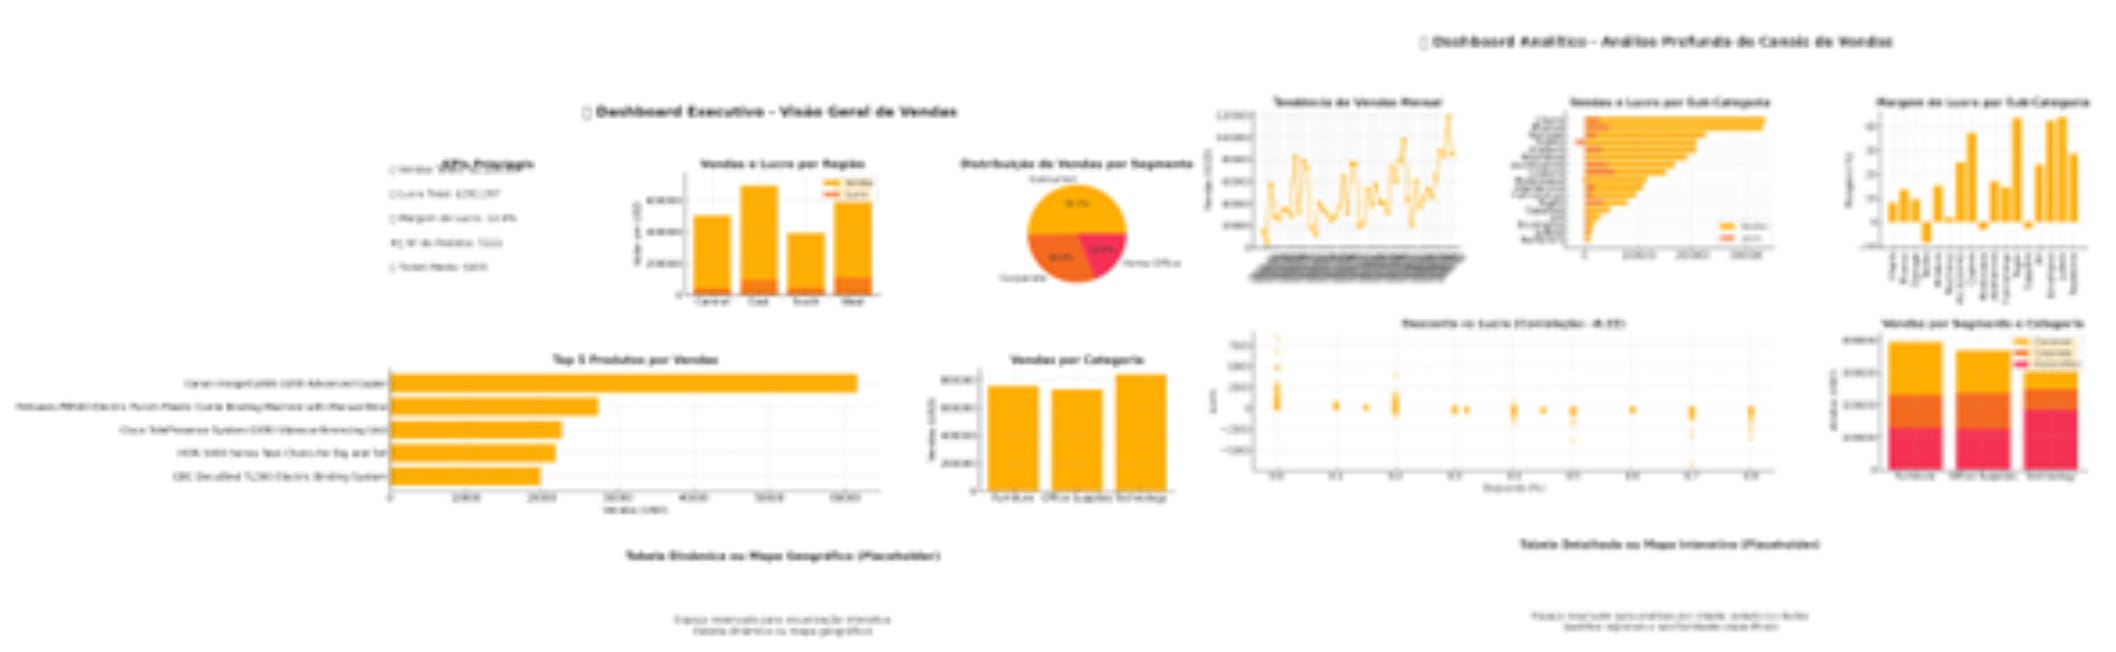
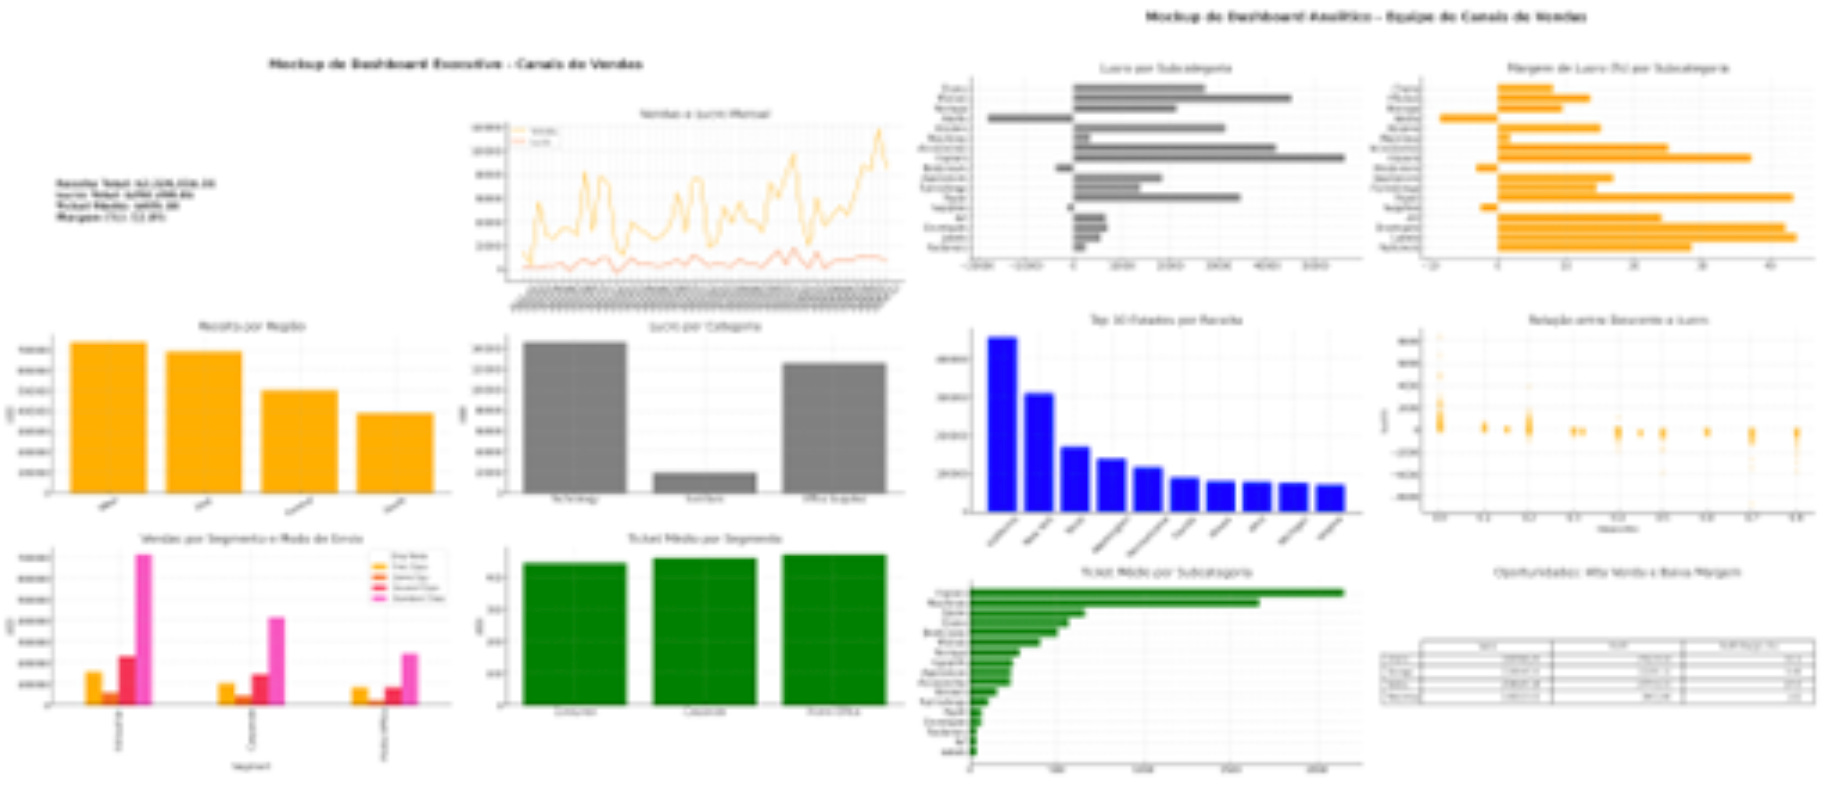
To measure the impact of clear guidance, we gave the same final briefing to the Data Analyst and Traditional ChatGPT and asked them to generate mockups. Mockups Generated:
Data Analyst, Executive and Analytical Dashboards

Traditional ChatGPT, Executive and Analytical Dashboards

The comparison showed that the agent with a clearly defined role (Data Analyst) produced noticeably stronger outputs, not just in visual quality, but in how well each dashboard aligned with its intended purpose. That said, the traditional ChatGPT brought a few interesting contributions to the table, such as contextualizing big numbers (BANs) by comparing them to previous periods.
Still, even with a solid briefing, the traditional model failed to fully adapt to the context: it used off-brand visual elements, repeated redundant blocks, and overlooked key usability requirements previously defined. That’s why we chose to move forward with the Data Analyst agent as the one responsible for the final mockups and phased out the traditional version.
Despite being more aligned with expectations, the initial mockups from the Data Analyst still had notable weaknesses:
Inefficient use of space;
Inconsistent or missing chart labels;
Typical AI issues, like stacking visual elements without a clear hierarchy.
It became clear that context alone wasn’t enough. That’s when we changed our approach.
🎭 Bringing It to Life: “The Gabriel Scenario”
Instead of simply reinforcing requirements, we framed the prompt as a practical scenario. The goal was to activate the model’s empathy and push it to make more human-like decisions, just as an experienced information designer would.
“You are the information designer. You need to build executive and analytical dashboards for Gabriel’s team. He just took over the area and received an urgent request from the VP to investigate a drop in product profitability. The executive dashboard must highlight this issue immediately. The analytical one should enable root-cause analysis. Update the briefing and wireframes accordingly.”
The results improved significantly:

The executive mockup emphasized key performance changes;
The visual hierarchy was clearer;
The analytical view included more insightful visualizations.
Behind the Scenes: The AI Co-Design Experience
If there’s one thing this experiment made clear, it’s this: ChatGPT is not an autopilot. It’s a copilot. And copilots only perform well when given a clear flight plan, with context, intent, and direction.
In Phase 1, we saw how the lack of briefing and orientation led to disconnected, unrealistic outputs. The AI threw charts together without concern for usability, spacing, or visual encoding. Even in Phase 2, with a structured team and clearly defined roles, mistakes persisted: poor practices, missing labels, inefficient layout use. Only when we introduced a practical use case, with pressure and expectations, did the outputs improve. And even then, success came only with human curation, critical revision, and ongoing prompt refinement.
In other words: AI doesn’t “solve.” It accelerates.
It helps produce better outcomes, but only if guided through iterative prompts built from prior results. This requires not just technical know-how, but business insight and a clear sense of purpose.
One pattern we noticed was the AI’s bias toward generic outputs.
It often defaulted to a "nice-looking dashboard" template, prioritizing popular charts or standardized layouts, even when they didn’t match the user’s journey. Z-pattern reading, spatial balance, focus on the core business question, all had to be taught, reinforced, and adapted.
The AI learns, but it’s stubborn, and it occasionally hallucinates.
The comparison between personalized agents and the traditional model showed that information design requires more than data processing: it demands sensitivity. The Data Analyst agent performed better because it understood the problem. But it only truly excelled after being trained through questions, simulations, constraints, and targeted instructions.
This project proved that generative AI can be a powerful ally in creative and analytical processes, if we know how to drive the conversation. Creating dashboards with AI isn’t about asking. It’s about dialoguing. Which means that the current model, common in many companies, of giving the AI a goal and expecting an outcome simply doesn’t work. Unlike a human analyst who would seek missing details and clarify unstated needs, the AI won’t.
Conclusion
This article emerged as a response to a real-world trend: companies justifying staff cuts by claiming that generative AI could maintain, if not improve, quality without human professionals.
And we’re not talking about hypotheticals. These are real decisions happening in both the U.S. and Brazil.
But are we truly ready to replace experienced professionals with AI?
MD101 Support ☎️
If you have any queries about the piece, feel free to connect with the author(s). Or feel free to connect with the MD101 team directly at community@moderndata101.com 🧡
Author Connect

Find me on LinkedIn 💬 | Find him on Medium here ↗️

Find me on LinkedIn 💬 | Find her Substack here:
🔖 | A guest post by
|
 | A guest post by
|
I liked this sentence a lot:
If there’s one thing this experiment made clear, it’s this: ChatGPT is not an autopilot. It’s a copilot. And copilots only perform well when given a clear flight plan, with context, intent, and direction.
----
I wholly agree with it. AI, in its current form, is a co-pilot, that can help us in our day to day, under clear instructions from humans. We'll see how it evolves, but even now the value is massive.