Evolving Data Models: Backbone of Rich User Experiences (UX) for Data Citizens
Hegel's Framework to Distill Value of Data Models underneath ANY and ALL User Interfaces, Good Traits of UX/UI in Data, and Addressing Fundamental User Emotions
TOC
Intro
The Relationship b/w User & Product = UX
What Drives User Experience for Data Users
— Evolving Data Models as Core Enablers
A Hegelian Lens to Grasp the Impact of Data Modeling on UX
— UX Evolution Explained Through Hegel’s Stages of Consciousness
Traits of Good UX in Data
Let’s Dive In
Sometimes, conveying the essence of something seems more important than conveying hard facts about it. Much like practical semantics. And often, it’s better to serve the dots instead of drawing the connections for users. It’s the consumers that conclude a producer’s work by connecting the dots for themselves - like how a painting exists in multiple forms across minds. Each a different piece of art - moulded by different observers with colours and context from their own lives and experiences.
A wordsmith sketches words on a train of thought,
A reader discovers it with another. Takes it home. Raises it. Lives it.
It’s the observer that concludes and activates knowledge.
The user’s context combined with information is essential to surface data in the right business environment. For example, a sales director would use the same sales data (strategic use: high-depth) differently from a sales associate (operational use: breadth). Similarly, the same sales data would be used in a completely different context by a marketing team.
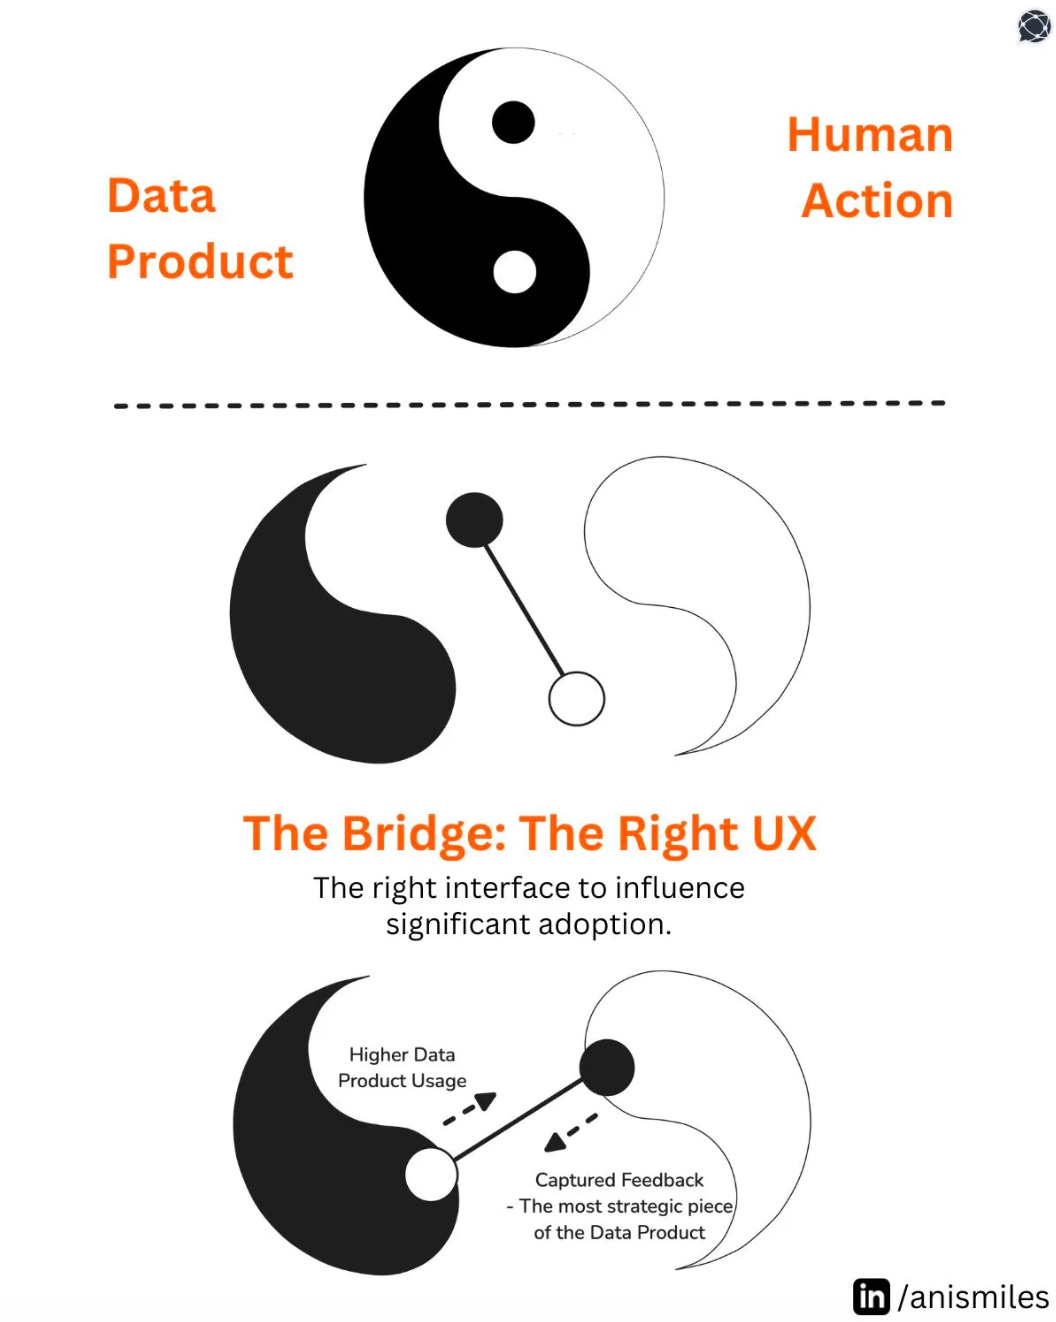
However, to enable this contextual activation, we need a bridge between information and the user. Just like how food needs to be cooked to be experienced, data and overwhelming quantities of it need to be picked and plated to reach the user and become knowledge. Accessibility, ease of use, right context.
The Relationship b/w User & Product = User Experience
Here are some observations from data and growth experts, boiling down everything to empathy.
A secret of the top growth experts in tech is to think about every UX interaction as an emotional event. ~ Darius Contractor, Head of Growth
Analytics should boil down to empathising with each individual
I'll tell you one story. We were looking at return data and, and one of the things we were looking at was the return reasons, right? And from a technical perspective, what we needed to do was just categorise these things. We used to sell pet beds and one of the return reasons was “my pet died and so I don't need the bed anymore.” And so she barely bought the bed for her pet, and then her pet died, so she just returned to bed. And that really hit us. Like we felt that in a very deep way.
It's not really optimising an experience for that customer, at least not in an obvious way. But one thing I'm a big proponent of is championing the customer voice, identifying what? Like what is it so people just don't spend money to spend money. There's a purpose, there's a reason there's usually a job that they need to fill What it what are those jobs? What are those problems? And then who are your customers and what is unique about them? And actually providing a context for that.~ Rho Lall, Senior Analytics Engineer at Purple. Excerpt from an upcoming episode of Analytics Heroes 🎧
To understand and boil down interfaces and product features to be reactive and empathetic towards basal human emotions, we don’t just need technical tools but a cultural and humane lens to build FOR the user.

The user experience must deliver net positive “emotional energy”. For example, glitchy interfaces cause frustration and trigger base emotions like anger and helplessness. A net negative emotional energy. The quick loading time of webpages enables users to navigate easily to their destination, triggering base emotions like relief and confidence. A net positive emotional energy.

What Drives User Experience for Data Consumers?
In the context of data, while on the surface it might seem that interfaces are the drivers of User Experience, in all practical reaches, the data model behind the scenes is the original and foundational driver of exemplary user experience for data users.
I’ll make a strong assertion: for data consumers to derive value from any interface, whether it involves chat or not, the underlying data modeling must be even stronger than today, not weaker…while LLM-powered interfaces, such as "chatting with your data" could be helpful, the core value of data is fundamentally determined by how effectively it captures the business model.
This reasoning can be derived from first principles:
Data represents business observations.
These observations are often scattered throughout the organization.
To be useful, these observations must be structured to model the underlying business processes in areas like sales, marketing, product, finance, and operations.
The closer this structure aligns with reality, the more valuable the collected data becomes.
The easier it is for business teams to operate on this structure, the greater the value of the data.
Evolving Data Models: The Core Enablers of Exceptional User Experience
At the heart of every satisfying user interaction (by data consumers) are evolving data models. Unlike stagnant models that become outdated as user behaviour shifts, evolving data models continuously adapt to reflect real-time insights, preferences, and patterns. This adaptability is the foundation for building data products that resonate deeply with users.
Interestingly, an evolving data model develops into an ecosystem of data products sprinkled across layers of users. Just as data goes through multiple layers of people, processes, and transformations before reaching the actual consumer. Notably, every layer of people and processes comes with its own cultural bias.
We can never take the risk of ignoring this bias. Ignoring it adds inefficiencies and frustrations in every layer. Products dispersed across layers take into account the concerns of users located in different layers. In other words, they consider how different data users like Analysts, Data Scientists, or CXOs prefer to ingest and explore data in their workspaces, how the data engineering team operates, or how governance stewards prefer to disperse policies.
What all these roles consider important as users = Direct feedback for product development.
Moving Towards Sustainable Solutions
To build an enduring solution, we need to focus on tools that can flexibly accommodate an evolving data model…. designed to easily extend the existing data model to add new features and dimensions on the fly without adding complexity to the underlying data model, ultimately addressing the core problem rather than just the symptoms.
Here’s a complete guide on how to establish evolving data models - exactly how the model(s) take evolution and dynamic user preferences/priorities into account. How models adapt to user requirements and evolve at the architectural level, serving solid user experience (where interfaces like Data Product Hubs, Data APIs, or Data App Interfaces are able to deliver satisfying user interactions). Access the guide here:
A Hegelian Lens to Grasp the Impact of Data Modeling on UX
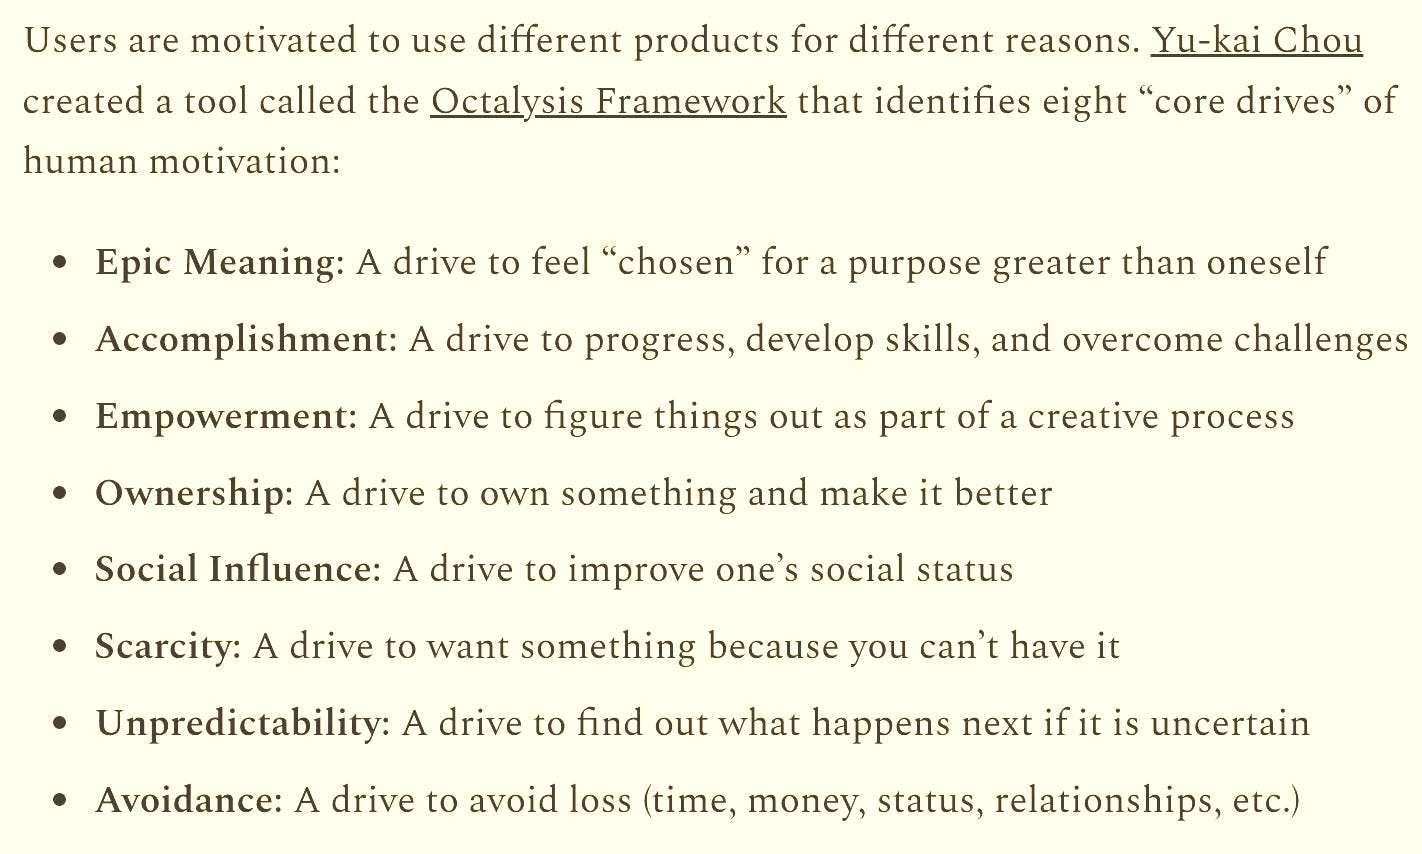
We spoke about addressing base human emotions as one of the strongest drivers of satisfying user experiences. UX that leaves the user with a net positive emotional energy, subconsciously registering the product as an ally.
But to identify and address the base emotions of specific user segments, we need an extremely rich understanding of the business itself. What does this business cater to? Who uses the products/services offered by the business? Can the users do without the offerings? What motivations drive this particular user segment and why? To what extent are the products improving the daily lives of these users?…and so on.
Any interface or user interaction point would be developed above this knowledge. Above an evolving model that captures the user’s motivations, habits, and requirements.
A little untraditional but fitting analogy is Hegel’s theory of consciousness and how it develops on interaction with other consciousnesses. Consider the user and the evolving model as different entities and how the interaction between the two emerges and transforms each other.
Hegel's philosophy of consciousness explores the progression of human awareness and self-understanding. This hugely influential work examines the development of consciousness through a dialectical process: opposing factors that chisel each other into their final states.
UX Evolution Explained Through Hegel’s Stages of Consciousness
Technology, while not as advanced, also has a basal consciousness → Motivations/Purpose, Behaviour, Interactive Abilities, Boundaries, Languages, and so on…
So, we’ll use the Hegelian analogy to present how overcoming friction in a data user’s experience becomes feasible with consistent interactions between the user and the underlying data model (beneath the UI- in whatever form it may be).
AI or intelligent chat interfaces, while promising, cannot bypass the foundational necessity of data modelling that captures rich business context. Instead, it must amplify the collaboration between users and data by building on the already strong foundation of the data model. Measurable data utility emerges not from flashy UX but from deeply modelled data structures that adapt to constantly evolving business needs.
Note before diving into the stages:
Each stage represents a specific relationship between the user and the product.
The progression is driven by contradictions between the two within each stage that push the data model to evolve naturally as a by-product of interaction.

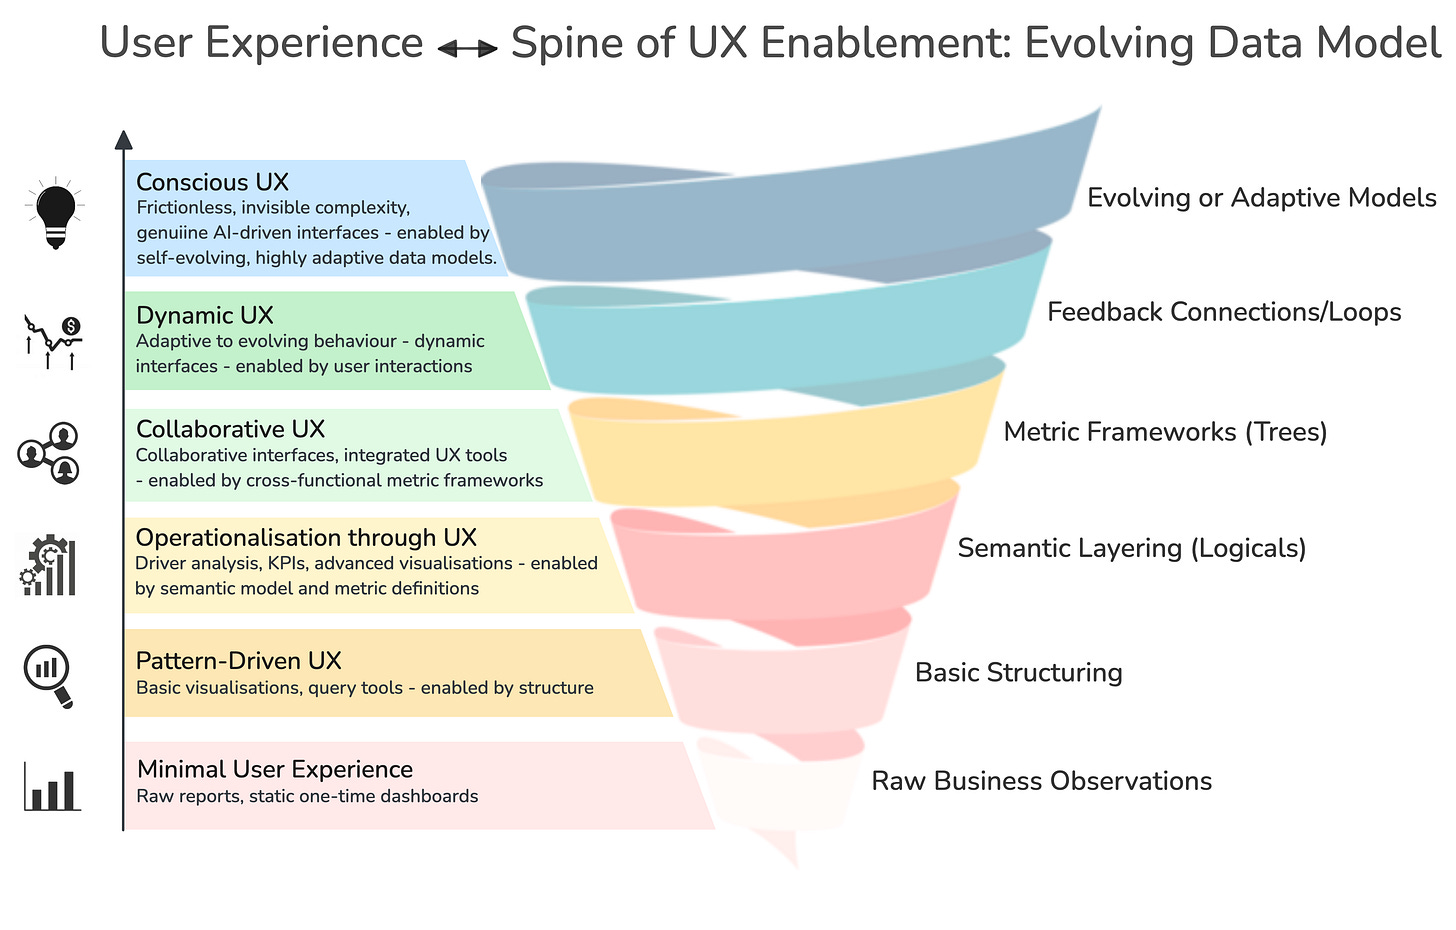
1. The Structure of Consciousness: The Foundational Data Model
In Hegel's framework, the structure of consciousness represents the foundation of human understanding. Similarly, in the realm of data, this aligns with the underlying data model—the initial structuring of business observations into logical entities and relationships.
The UX here is rudimentary, similar to Hegel's "immediate consciousness," where users interact with raw data as it exists. Early challenges arise due to the incomplete alignment of the data model with the business processes. For users, this stage represents friction as they grapple with unstructured, inconsistent data representations.
2. Stages of Consciousness: Refining Data-UX Interactions
a. Sense-Certainty: Initial Data Consumption
At this stage, users consume data in its most immediate form—reports, dashboards, or basic spreadsheets. The UX is highly fragmented, reflecting surface-level interactions with data. Users may experience satisfaction at first, as they can "see" data, but frustrations soon emerge because the interface fails to contextualise data against the business model.
b. Perception: Recognizing Patterns in Data
As organizations refine their data modelling foundations, users begin to perceive patterns and relationships. UX evolves to enable recognition—think of visualizations, filters, and query builders. However, a gap often persists between what users perceive and the underlying business truth, leading to partial utility.
c. Force and Understanding: Operationalizing Insights
In this stage, users seek to go beyond perception, striving to understand the forces behind the data—cause-and-effect relationships and drivers of performance. Here, UX begins to play a strategic role, guiding users to uncover insights. Tools like semantic layers and advanced metric frameworks (e.g., metric trees) enable alignment between UX and the underlying data model, reducing friction.
3. Self-Consciousness: The Emergence of Analytical Culture
Self-consciousness in Hegel's philosophy involves self-awareness and recognition of the "other." In data terms, this is when organizations become aware of their analytical maturity and the gap between data capabilities and decision-making needs. UX must now bridge data producers (engineers, modellers) and data consumers (business users).
Key advancements include collaborative platforms that demystify the data model and interfaces that abstract complexity for business users while maintaining the fidelity of underlying models.
4. Reason: Aligning Data with Business Realities
Reason represents the reconciliation of theory and practice. In the data world, this is where the data model achieves high fidelity with the business model, and UX ensures seamless accessibility. At this stage:
Data interfaces (chatbots, dashboards, apps) adapt dynamically to user queries.
The gap between data consumers and the underlying complexity of the model shrinks.
Analytical culture begins to flourish as users can trust and operationalize data without extensive mediation.
5. Absolute Spirit: Frictionless Data Adoption
Absolute Spirit in Hegel's philosophy represents the synthesis of individual and universal understanding. In the context of data products, this is the stage where:
UX dissolves into the background, becoming nearly invisible.
Data consumers interact naturally with insights as if the data model were an extension of their thought process.
AI and advanced interfaces (e.g., generative AI for natural language queries) help users seamlessly operate on the business-aligned data model.
However, this state can only exist if the underlying data model accurately reflects business reality. This is where metric trees and other frameworks become vital, ensuring that the foundation is strong enough to support intuitive, frictionless, and collaborative UX.
Traits of Good UX in Data
Guide Instead of Assist
Contrary to the apparent laws of engineering, it bodes well to address user emotions before the user “wants”. What the user “needs” is directly tied to base emotions, whereas clearcut wants to address immediate goals that may or may not align with the fundamental motivations of the user.
The function of a good user experience is not just tending to instructions but to lead the experience with value. For example, highlighting the best features like top-tier or golden data assets that have been popular among the user’s domain teams.
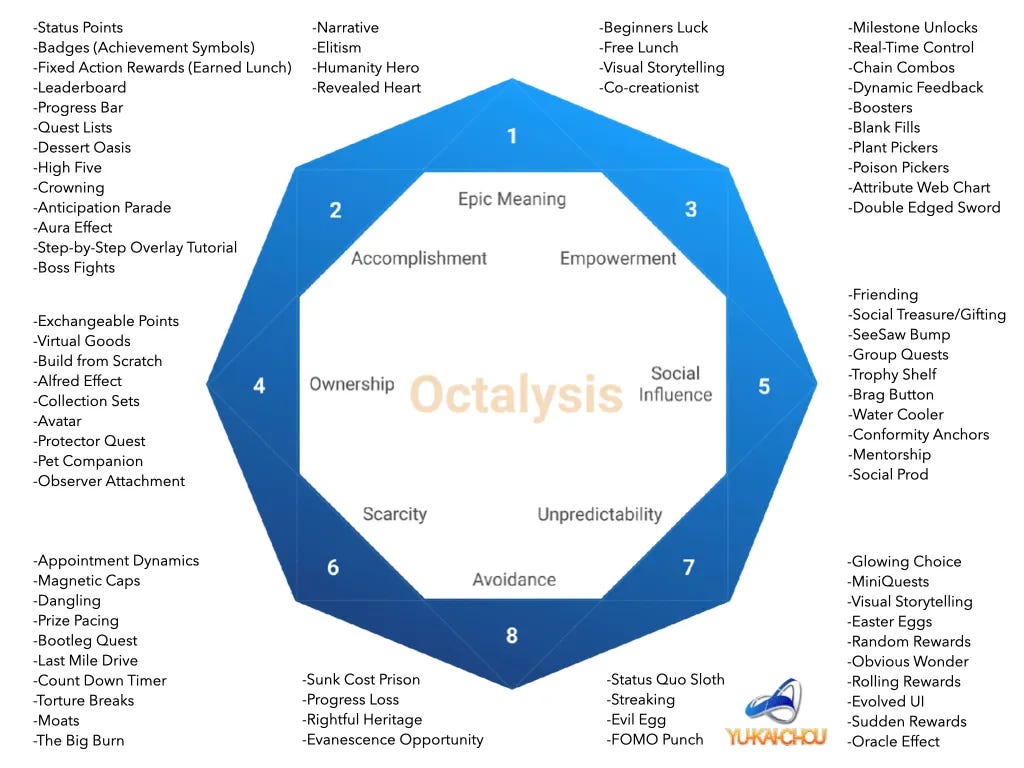
Gamification
Gamification is a reinforcement framework that targets base emotions like motivation, accomplishment, and social encouragement. Gamified experiences help users stay engaged through longer loops of complex tasks. Crumbs of accomplishment on the way provide a transparent view of the roadmap to the user - how far they are from the larger goal.
This is reflected by semantic data models and catalogs which project
scores for quality, upvotes for pipelines/reusable code, the adoption rate of datasets (motivation for data & analytics engineers using the platform),
upvotes for semantic data/descriptions/metadata, leaderboards for compliance/policy management (motivation for governance stewards)
comparative views/metrics of KPIs across time, leaderboards for usage of data delivery/output ports (motivation for analysts and stakeholders)
Onboarding Experience
Pre-Onboarding
The user growth funnel needs to percolate to the data product- the bottom of the funnel is the product itself. A big user base must convert for trial interfaces, and then a segment of them should be onboarded to customers of the data product.
For example, exploration features that enable users to play around with the semantic model and query on the fly. Once they are satisfied, they should be able to export the queries and activate the data to tools or interfaces in their native stacks (e.g. tableau, data/AI apps, AI models, etc.). Some other examples of other features would be search, browse, and simulation of models.
Post-Onboarding
The purpose of good post-onboarding exercises is, first, to reduce involuntary churn and, second, to reduce voluntary churn. Involuntary churn often results from factors that are beyond the control of users, like incompatibility with native tools, change of payment mode, which is not supported by the vendor’s subscription options, or cultural barriers. Voluntary churn results from pure dissatisfaction and frustration from using the product.
Examples: Addressing involuntary churns: Building unified interfaces that are able to talk to native stacks of domains for cross-domain interactions.
Addressing voluntary churns: Low query runtimes, easy root cause analysis of failing queries, clear lineage of the asset’s journey (crucial feature).
Personalisation
It goes without saying that personalisation is so important nowadays that it doesn’t need an explicit mention. It’s a must-have but equally challenging to achieve if the foundations are not set up correctly. Personalisation is one of the most powerful features inherently enabled by Evolving Data Models. It is not simply about recommending what a user might like; but about adapting the experience to align with individual preferences, workflows, and goals.
A good UX personalisation strategy accounts for the unique nuances of each user. For instance, surfacing relevant data sets, pipelines, or models based on the user’s past interactions, role, or team objectives. It emphasises relevance over abundance, ensuring users are not overwhelmed with choices but are empowered by clarity.
When executed well, personalisation builds a sense of ownership.
Dynamic Dashboards: Tailoring the display of KPIs, insights, and data outputs based on individual or team-specific contexts.
Role-Aware Interfaces: Adjusting available tools and options depending on whether the user is a data engineer, analyst, or governance steward.
Smart Recommendations: Suggesting reusable assets, semantic definitions, or pipeline improvements that align with the user’s recent activities or goals.
Preference Persistence: Remembering and adapting to the user’s preferred filters, themes, or organizational hierarchies over time.
Shareability
Shareability metrics are the true drivers of adoption. In a data platform, the ability to seamlessly share insights, datasets, pipelines, or models transforms the user experience from being individual-centric to community-driven. Reusability, high adoption, resource optimisation.
This not only amplifies data's value but also creates a network effect where assets gain utility and recognition through reuse and feedback. Evolving models register feedback and push it back to consumer-facing interfaces.
A well-designed shareability framework enhances visibility and collaboration across teams, making the platform indispensable. Virality of assets or features arises when users recognise the value of shared artefacts and actively promote them within their circles. For instance, a dataset that consistently solves recurring business questions can gain traction as the “go-to” resource for domain teams.
Easy Sharing Mechanisms: One-click options to share data assets, pipelines, or dashboards with individuals, teams, or external stakeholders with clear access permissions.
Collaborative Annotations: Enabling users to co-create by adding context, notes, or semantic descriptions to shared assets.
Virality Metrics: Highlighting popular assets with metrics like adoption rates, reuse frequency, or upvotes, encouraging others to explore and adopt them.
Social Proof: Showcasing top contributors or teams responsible for creating and curating high-value assets, fostering recognition and a sense of competition.
Cross-Team Discovery: Facilitating discovery of shared assets by integrating recommendations and search results that extend beyond a user’s immediate workspace.
This drives a sense of collective achievement. It elevates the platform from being a repository to a vibrant ecosystem where assets evolve, improve, and inspire new use cases through shared contributions.
Comment on some of the other traits that you’ve found indispensable for good data UX!
MD101 Support ☎️
If you have any queries about the piece, feel free to connect with the author(s). Or feel free to connect with the MD101 team directly at community@moderndata101.com 🧡
Author Connect
Find me on LinkedIn 🙌🏻
Find me on LinkedIn 🤝🏻
Find me on LinkedIn 🫶🏻


This article is outstanding. I have 30+ users working in UX and as a sude effect, many applications that rely on coherent data aligned to users conceptual model, and I lived reading this article and seeing so much of what i have learned reflected. Particularly love the hierarchy of emotional needs serviced by data of increasingly advanced quality to the extent of aligned consciousness. Wonderful. This takes UX away from its fixation on the User Interface as a mechanism to articulate intent towards, the UI to the world of data with its quality assessment in terms of its distance from the users mental model 👏